
Citation: Uhlmann, E.; Holznagel, T.;
Clemens, R. Practical Approaches for
Acoustic Emission Attenuation
Modelling to Enable the Process
Monitoring of CFRP Machining. J.
Manuf. Mater. Process. 2022,6, 118.
https://doi.org/10.3390/
jmmp6050118
Academic Editors: Bruce L. Tai
and ChaBum Lee
Received: 8 September 2022
Accepted: 30 September 2022
Published: 8 October 2022
Publisher’s Note: MDPI stays neutral
with regard to jurisdictional claims in
published maps and institutional affil-
iations.
Copyright: © 2022 by the authors.
Licensee MDPI, Basel, Switzerland.
This article is an open access article
distributed under the terms and
conditions of the Creative Commons
Attribution (CC BY) license (https://
creativecommons.org/licenses/by/
4.0/).
Manufacturing and
Materials Processing
Journal of
Article
Practical Approaches for Acoustic Emission Attenuation
Modelling to Enable the Process Monitoring of CFRP Machining
Eckart Uhlmann 1,2, Tobias Holznagel 1,* and Robin Clemens 1
1Institute for Machine Tools and Factory Management (IWF), Technische Universität Berlin, Pascalstraße 8-9,
10587 Berlin, Germany
2Fraunhofer Institute for Production Systems and Design Technology IPK, Pascalstraße 8-9,
10587 Berlin, Germany
*Correspondence: [email protected]
Abstract:
Acoustic emission-based monitoring of the milling process holds the potential to detect
undesired damages of fibre-reinforced plastic workpieces, such as delamination or matrix cracking.
In addition, abrasive tool wear, tool breakage, or coating failures can be detected. As measurements
of the acoustic emission are impacted by attenuation, dispersion, and reflection as it propagates
from source to sensor, the waveforms, amplitudes, and frequency content of a wave packet differ
depending on the propagation length in the workpiece. Since the distance between acoustic emission
sources and a stationary sensor attached to the workpiece changes continually in circumferential
milling, the extraction of meaningful information from the raw measurement data is challenging
and requires appropriate signal processing and frequency-dependent amplification. In this paper,
practical and robust approaches, namely experimentally identified transfer functions and frequency
gain parameter tables for attenuation modelling, which in reverse enable the reconstruction of
frequency spectra emitted at the acoustic emission source, are presented and discussed. From the
results, it is concluded that linear signal processing can largely compensate for the influence of
attenuation, dispersion, and reflection on the frequency spectra and can therefore enable acoustic
emission based process monitoring.
Keywords: attenuation; acoustic emission; CFRP; milling; process monitoring
1. Introduction
The milling of carbon fibre-reinforced plastics (CFRP) remains a challenging process
in manufacturing. Since the carbon fibres are highly abrasive, high tool wear rates occur.
To enhance tool life, state-of-the-art milling tools with diamond coatings and segmented
cutting edges are employed in industry. Nevertheless, even with these improvements,
machining with a worn tool leads to higher cutting temperatures and increasing cutting
forces [
1
]. These result in poor surface quality and undesired workpiece damages, such as
matrix cracking, delamination or fibre protrusion [
2
]. Damage to the workpiece reduces
fatigue strength considerably, and therefore workpieces must be inspected by quality
control and reworked or disposed of, if necessary.
One approach to avoid workpiece damages and thus eliminate laborious workpiece
inspections is acoustic emission (AE) based process monitoring. AE is emitted by the
release of strain energy, e.g., by deformation, friction, breakage or impact in the cutting
zone. Therefore, it holds the potential to monitor the tool wear state as well as undesired
workpiece damages. However, because these different phenomena are meant to be quanti-
fied with one measurand, special care needs to be taken when analysing AE generation,
propagation, sensor coupling and transduction. The same applies to the parameterisation of
the downstream signal processing algorithms e.g., for process monitoring. Often neglected
in academic works on AE process monitoring for machining are effects like attenuation,
J. Manuf. Mater. Process. 2022,6, 118. https://doi.org/10.3390/jmmp6050118 https://www.mdpi.com/journal/jmmp

J. Manuf. Mater. Process. 2022,6, 118 2 of 13
dispersion and reflection in the AE propagation path. The impact of these effects on mea-
surement signals depends on material properties, geometric setup and workpiece clamping
equipment. They pose a serious challenge for AE-based process monitoring approaches.
To fill this research gap, practical and robust experimental algorithms which account for
such phenomena are presented and discussed in this paper.
As AE propagates through a solid, it is subjected to attenuation, dispersion and
reflection. Therefore, measured waveforms, amplitudes and frequency content of a wave
packet depend on the distance and the positioning of AE source and sensor. The effects of
attenuation, dispersion, reflection, and positioning are significant and, in most cases, must
not be neglected when evaluating different AE measurement results. A short introduction
on the theoretical background of these phenomena is given in the following section.
Attenuation can be observed as a decline in signal amplitude due to geometric spread
as well as material absorption and internal friction resulting from the viscoelastic nature of
the workpiece. Attenuation coefficients
α
(f) are frequency-dependent and can be identified
experimentally using Equation (1) [3–6].
α(f)=1
x2−x1lnVm1√x1
Vm2√x2(1)
where V
m1
and V
m2
are the amplitudes of a discrete signal frequency at the radial distances
x
1
and x
2
. If the attenuation coefficients
α
(f) are constant for different distances to the source
x, which might not always be given, amplitude V
m
can be calculated using Equation (2) [
7
].
Vm=1
√xVe−α(f)x(2)
where V is the amplitude at the AE source. Ono and Gallego [
3
] identified attenuation
coefficients for aluminium as well as unidirectional, cross-ply and quasi-isotropic CFRP.
Abdulaziz et al. [
8
] identified the attenuation coefficients for different distances and angles
between glass fibres and the AE propagation path experimentally. High directivity, meaning
dependence of the attenuation coefficient on the angle between fibres and the propagation
path, was reported. It was also shown that external bending load on the CFRP specimen
can impact attenuation coefficients significantly [
6
]. Theoretical modelling of attenuation,
e.g., with numerical approaches, are based on Voigt-Kelvin or Boltzmann models for the
relationship of tension
σ
and elongation
ε
but might not be applicable for complex part
geometries and material properties [9–11].
Dispersion denotes the effect of frequency-dependent phase velocity v
p
. Higher
frequencies may propagate, depending on the wave mode, with a different velocity than
lower frequencies. Therefore, the shape of a wave packet changes along the propagation
path. Different wave velocities have been reported for AE propagation in unidirectional
CFRP, depending on the angle between the signal path and the fibre orientation [
12
].
Phase velocities can be obtained experimentally or estimated based on workpiece material
properties [
13
]. For the frequency spectrum of around 0–250 kHz, which is induced during
the milling and drilling process, significant differences in phase velocities are reported,
thus a strong influence of dispersion is to be expected [14].
Reflection of AE occurs at workpiece edges. Once the wavepacket hits an interface
with the angle
θ1
, it is reflected under angle
θ1
and refracted and propagates further under
a certain angle
θ2
which can be estimated with the indices of refraction c
1
and c
2
using
Equation (3).
sin(θ1)
sin(θ2)=c2
c1
(3)
In most cases, reflections and refractions are considered a disturbance. Therefore,
experimental setups are often realised to minimise the effects of reflection on measurements.
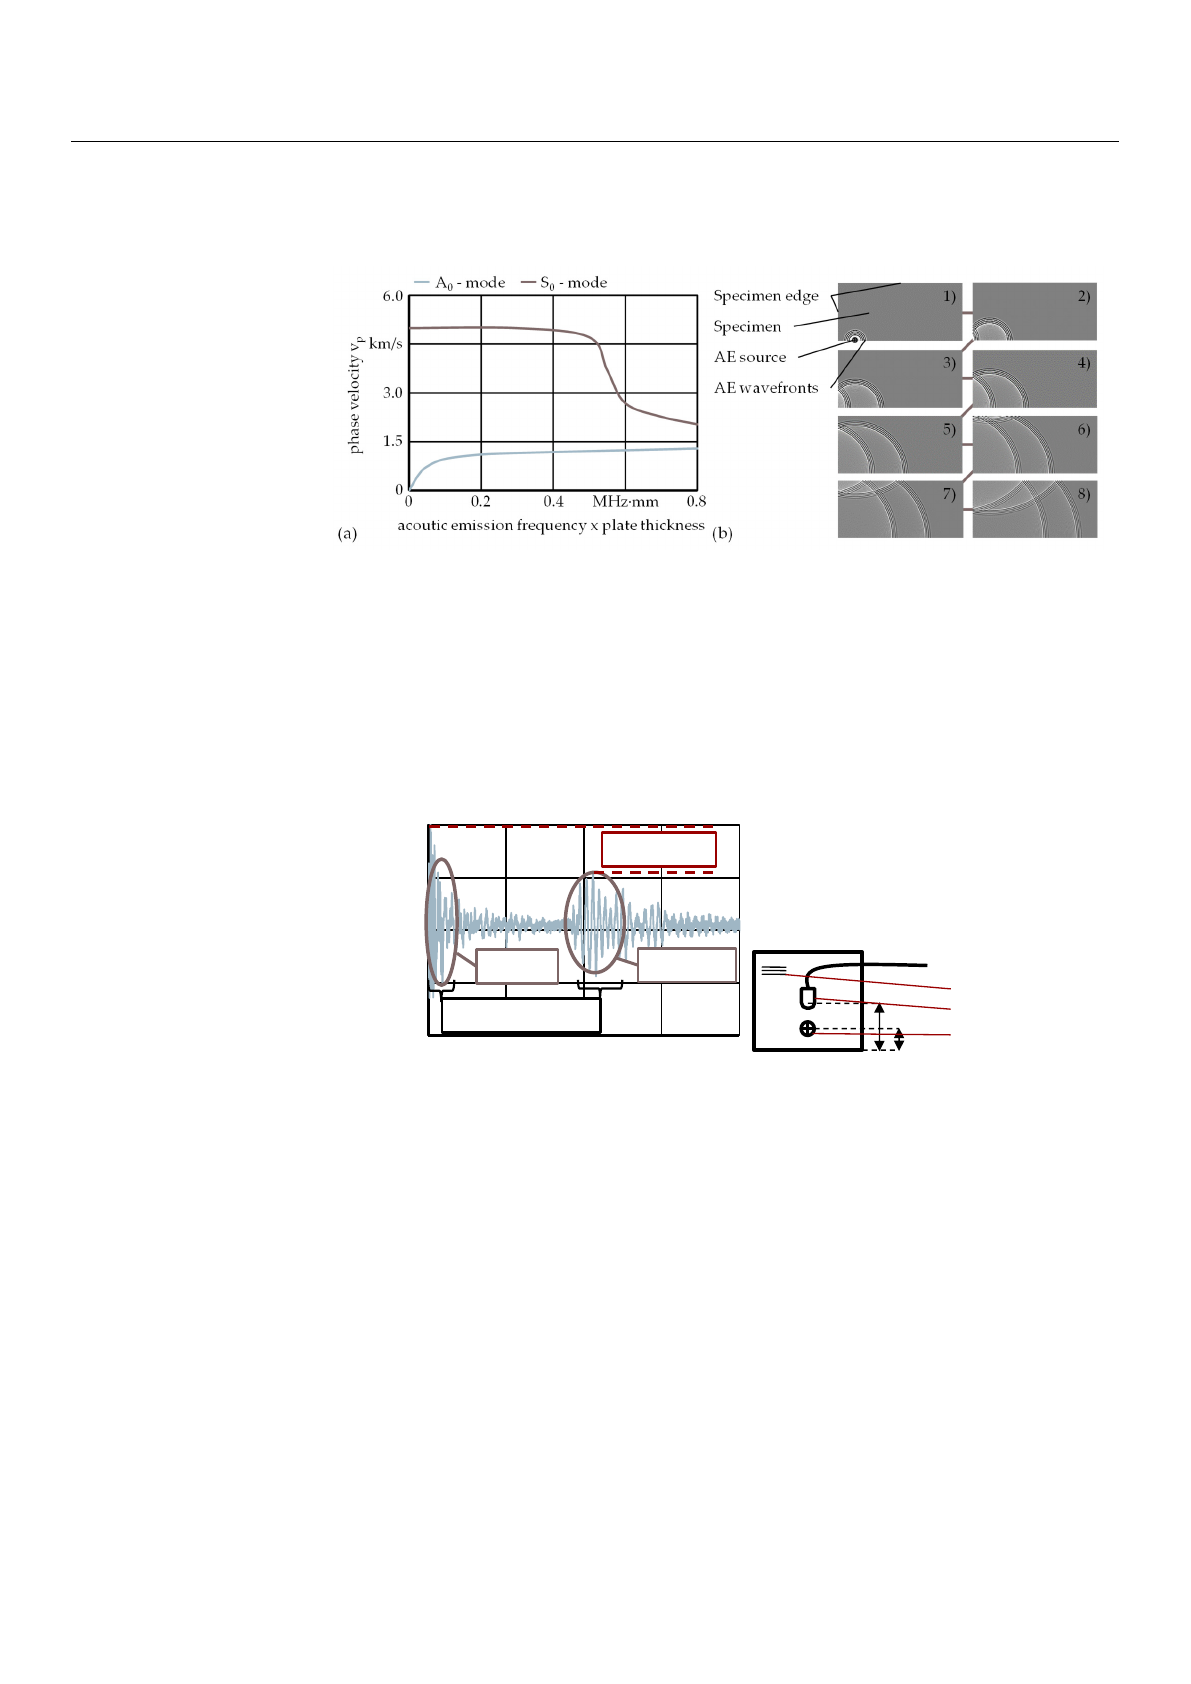
Generic dispersion curves for the wave modes A
0
and S
0
as well as a simplified illustration
J. Manuf. Mater. Process. 2022,6, 118 3 of 13
of the propagation of an AE wave as it is reflected at the workpiece edges are presented in
Figure 1.
J. Manuf. Mater. Process. 2022, 6, 118 3 of 14
sin(ϴ)
sin(ϴ) = c2
c (3)
In most cases, reflections and refractions are considered a disturbance. Therefore,
experimental setups are often realised to minimise the effects of reflection on
measurements. Generic dispersion curves for the wave modes A
0
and S
0
as well as a
simplified illustration of the propagation of an AE wave as it is reflected at the workpiece
edges are presented in Figure 1.
Figure 1. Dispersion and reflection; (a) dispersion curves; (b) reflection of AE at workpiece edges of
the specimen.
The impact of the discussed attenuation, dispersion and reflection phenomena on an
AE wave packet emitted by a Hsu-Nielsen source close to a workpiece edge to provoke
reflection is shown in Figure 2. It can be observed that AE propagation distances of several
centimetres in CFRP already have a significant impact on the transduced measurement
signal as the maximum amplitude decreases due to attenuation and the waveform distorts
due to dispersion.
Figure 2. AE measurement demonstrating the effects of attenuation, dispersion and reflection.
AE-based approaches are applied for different monitoring tasks for a variety of
machining processes [15–17]. In grinding, the contact recognition of the grinding wheel
and workpiece, as well as the detection of grinding burn, can be realised [18,19]. Therefore,
AE monitoring is common in industrial grinding applications. Boaron et al. [20] developed
a quick-test method for the characterization of grinding wheel topography based on AE.
Bi et al. [21] developed a tool condition monitoring system for grinding based on AE and
a long short-term memory network. For milling, Giriray et al. [22] used the root mean
squares (RMS) of an AE signal to predict the flank wear on a tool using an artificial neural
network (ANN). Marinescu and Axinte [23] detected surface anomalies in the workpieces
and entrances of individual cutting edges. For micro-milling, Uhlmann et al. [24] used AE
measurements for tool contact detection. Prakash et al. [25] showed a relation between the
04010
200
−100
200
acoustic emission
signal AE
raw
20
0
kSamples
AE measurement
Kistler 8152C0
AE source
HSU-NIELSEN source
Workpiece
SGL Carbon SIGRAPREG
®
mV
first hit reflection
attenuation
dispersion
50 mm
20 mm
Fibre orientation
AE sensor
AE source
timesteps t
Figure 1.
Dispersion and reflection; (
a
) dispersion curves; (
b
) reflection of AE at workpiece edges of
the specimen.
The impact of the discussed attenuation, dispersion and reflection phenomena on an
AE wave packet emitted by a Hsu-Nielsen source close to a workpiece edge to provoke
reflection is shown in Figure 2. It can be observed that AE propagation distances of several
centimetres in CFRP already have a significant impact on the transduced measurement
signal as the maximum amplitude decreases due to attenuation and the waveform distorts
due to dispersion.
J. Manuf. Mater. Process. 2022, 6, 118 3 of 14
sin(ϴ)
sin(ϴ) = c2
c (3)
In most cases, reflections and refractions are considered a disturbance. Therefore,
experimental setups are often realised to minimise the effects of reflection on
measurements. Generic dispersion curves for the wave modes A
0
and S
0
as well as a
simplified illustration of the propagation of an AE wave as it is reflected at the workpiece
edges are presented in Figure 1.
Figure 1. Dispersion and reflection; (a) dispersion curves; (b) reflection of AE at workpiece edges of
the specimen.
The impact of the discussed attenuation, dispersion and reflection phenomena on an
AE wave packet emitted by a Hsu-Nielsen source close to a workpiece edge to provoke
reflection is shown in Figure 2. It can be observed that AE propagation distances of several
centimetres in CFRP already have a significant impact on the transduced measurement
signal as the maximum amplitude decreases due to attenuation and the waveform distorts
due to dispersion.
Figure 2. AE measurement demonstrating the effects of attenuation, dispersion and reflection.
AE-based approaches are applied for different monitoring tasks for a variety of
machining processes [15–17]. In grinding, the contact recognition of the grinding wheel
and workpiece, as well as the detection of grinding burn, can be realised [18,19]. Therefore,
AE monitoring is common in industrial grinding applications. Boaron et al. [20] developed
a quick-test method for the characterization of grinding wheel topography based on AE.
Bi et al. [21] developed a tool condition monitoring system for grinding based on AE and
a long short-term memory network. For milling, Giriray et al. [22] used the root mean
squares (RMS) of an AE signal to predict the flank wear on a tool using an artificial neural
network (ANN). Marinescu and Axinte [23] detected surface anomalies in the workpieces
and entrances of individual cutting edges. For micro-milling, Uhlmann et al. [24] used AE
measurements for tool contact detection. Prakash et al. [25] showed a relation between the
04010
200
−100
200
acoustic emission
signal AE
raw
20
0
kSamples
AE measurement
Kistler 8152C0
AE source
HSU-NIELSEN source
Workpiece
SGL Carbon SIGRAPREG
®
mV
first hit reflection
attenuation
dispersion
50 mm
20 mm
Fibre orientation
AE sensor
AE source
timesteps t
Figure 2. AE measurement demonstrating the effects of attenuation, dispersion and reflection.
AE-based approaches are applied for different monitoring tasks for a variety of ma-
chining processes [
15
–
17
]. In grinding, the contact recognition of the grinding wheel and
workpiece, as well as the detection of grinding burn, can be realised [
18
,
19
]. Therefore, AE
monitoring is common in industrial grinding applications. Boaron et al. [
20
] developed
a quick-test method for the characterization of grinding wheel topography based on AE.
Bi et al. [
21
] developed a tool condition monitoring system for grinding based on AE and
a long short-term memory network. For milling, Giriray et al. [
22
] used the root mean
squares (RMS) of an AE signal to predict the flank wear on a tool using an artificial neural
network (ANN). Marinescu and Axinte [
23
] detected surface anomalies in the workpieces
and entrances of individual cutting edges. For micro-milling, Uhlmann et al. [
24
] used AE
measurements for tool contact detection. Prakash et al. [
25
] showed a relation between the
AE signal and tool wear for high-speed edge trimming. Möhring et al. [
26
] reported on
the correlation of the AE signal with tool wear and surface quality in comparison to other
process measurands like cutting forces and workpiece vibrations in milling CFRP. For the
drilling process, Arul et al. [
27
] showed the correlation of AE RMS values with tool wear
and thrust force.

J. Manuf. Mater. Process. 2022,6, 118 4 of 13
In all examined and presented publications, sensors were attached to the workpiece
or the workpiece clamping. Signal processing algorithms to compensate for the effects of
attenuation, dispersion and reflection are not applied. However, when attaching the AE
sensor to the workpiece and machining at different distances to the sensor, several authors
report significant disturbances on measurements [
28
,
29
]. Above all, a drastic reduction in
signal amplitude with increasing distance between source and sensor is observed. Since the
stationary sensor needs to be attached to each new workpiece, the coupling conditions may
only be poorly reproducible in a way that may not allow consistent comparability of the
measurements across workpieces during machining [
3
]. Everson and Cheraghi therefore
recommend digressing from workpiece sided AE sensors and rather to attach the sensor on
the tool holder [
30
]. A comprehensive literature review on state-of-the art machining of
CFRP and polymers is given by Che et al. [
31
]. Further applications and challenges of AE
measurement in machining processes are analysed and reviewed by Kishawy et al. [32].
Nevertheless, stationary AE measurement can be a practical approach for application-
specific monitoring tasks in machining. However, to improve the quality of processed AE
signals, a more sophisticated evaluation of the measurements, the discussed drawbacks and
challenges, such as the influence of attenuation, dispersion, and reflection on the measured
signal need to be considered. This is especially true for the machining of CFRPs, which have
much higher attenuation coefficients than for example, metals and in the milling process,
where the distances between AE source and sensor are allowed to vary considerably as the
tool travels at the edge of large CFRP parts. Both the influence of different distances between
AE source and sensor as well as signal path and fibre orientation must be compensated for,
the latter due to the anisotropic nature of most CFRPs.
2. Materials and Methods
AE were induced by the milling process or alternatively, with compressed air at a
pressure of p= 8 bar. Experiments with compressed air can be easily conducted outside of
the machine tool and can be used to pre-parameterise models which are then applied to
the milling process measurements. The milling experiments have been conducted using
an Ultrasonic C260 Composites of the company Sauer Gmbh, Stipshausen, Germany. As a
workpiece, plates of unidirectional Cfrp Sigrapreg
®
supplied by the company SGL Carbon
Se, Wiesbaden, Germany, with a thickness of 2 mm were used. AE was measured with a
stationary sensor Type 8152C0 manufactured by the company Kistler Instrumente Gmbh,
Sindelfingen, Germany, attached to the workpiece. The sensor has a high sensitivity of
S = 57 dB V/(m/s)
in the range of 50 kHz to 400 kHz. The signal is filtered by a bandpass
with the cut-off frequencies f
cLL
= 50 kHz and f
cUL
= 1000 kHz in a piezotron coupler
5125. Another AE sensor AE9039, rotating, was attached with a frictional connection to
the tool holder powRgrip HSK F63/PG25x100H of the company Rego-Fix AG, Tenniken,
Switzerland. The signal of the rotating sensor is amplified by a control card AEMS5522Q.
The rotating sensor, the stator as well as the control card are supplied by the company
Accretech Sbs Inc., Portland, OR, USA. Both sensor signals are digitalised using a PicoScope
5444D from the company Pico Technology Ltd., Cambridgeshire, UK with a sampling
rate of 2.906 MS/s with a vertical resolution of r = 15 Bits. Since the machine tool axis
amplifiers induce high frequencies into the power grid, which can disturb the AE measure-
ment, low pass filters were applied to the power supplies of all AE equipment. For the
milling processes, an uncoated R&D milling tool FE100S manufactured by the company
Hufschmied Zerspanungssysteme, Bobingen, Germany, was employed. For all machining
experiments dry, down milling processes were applied. All measurement programs, signal
processing and model parameterisation scripts are written with Python 3.9.5 from Python
Software Foundation, Wilmington, USA. Sensors, clamping setup, and AE sources were
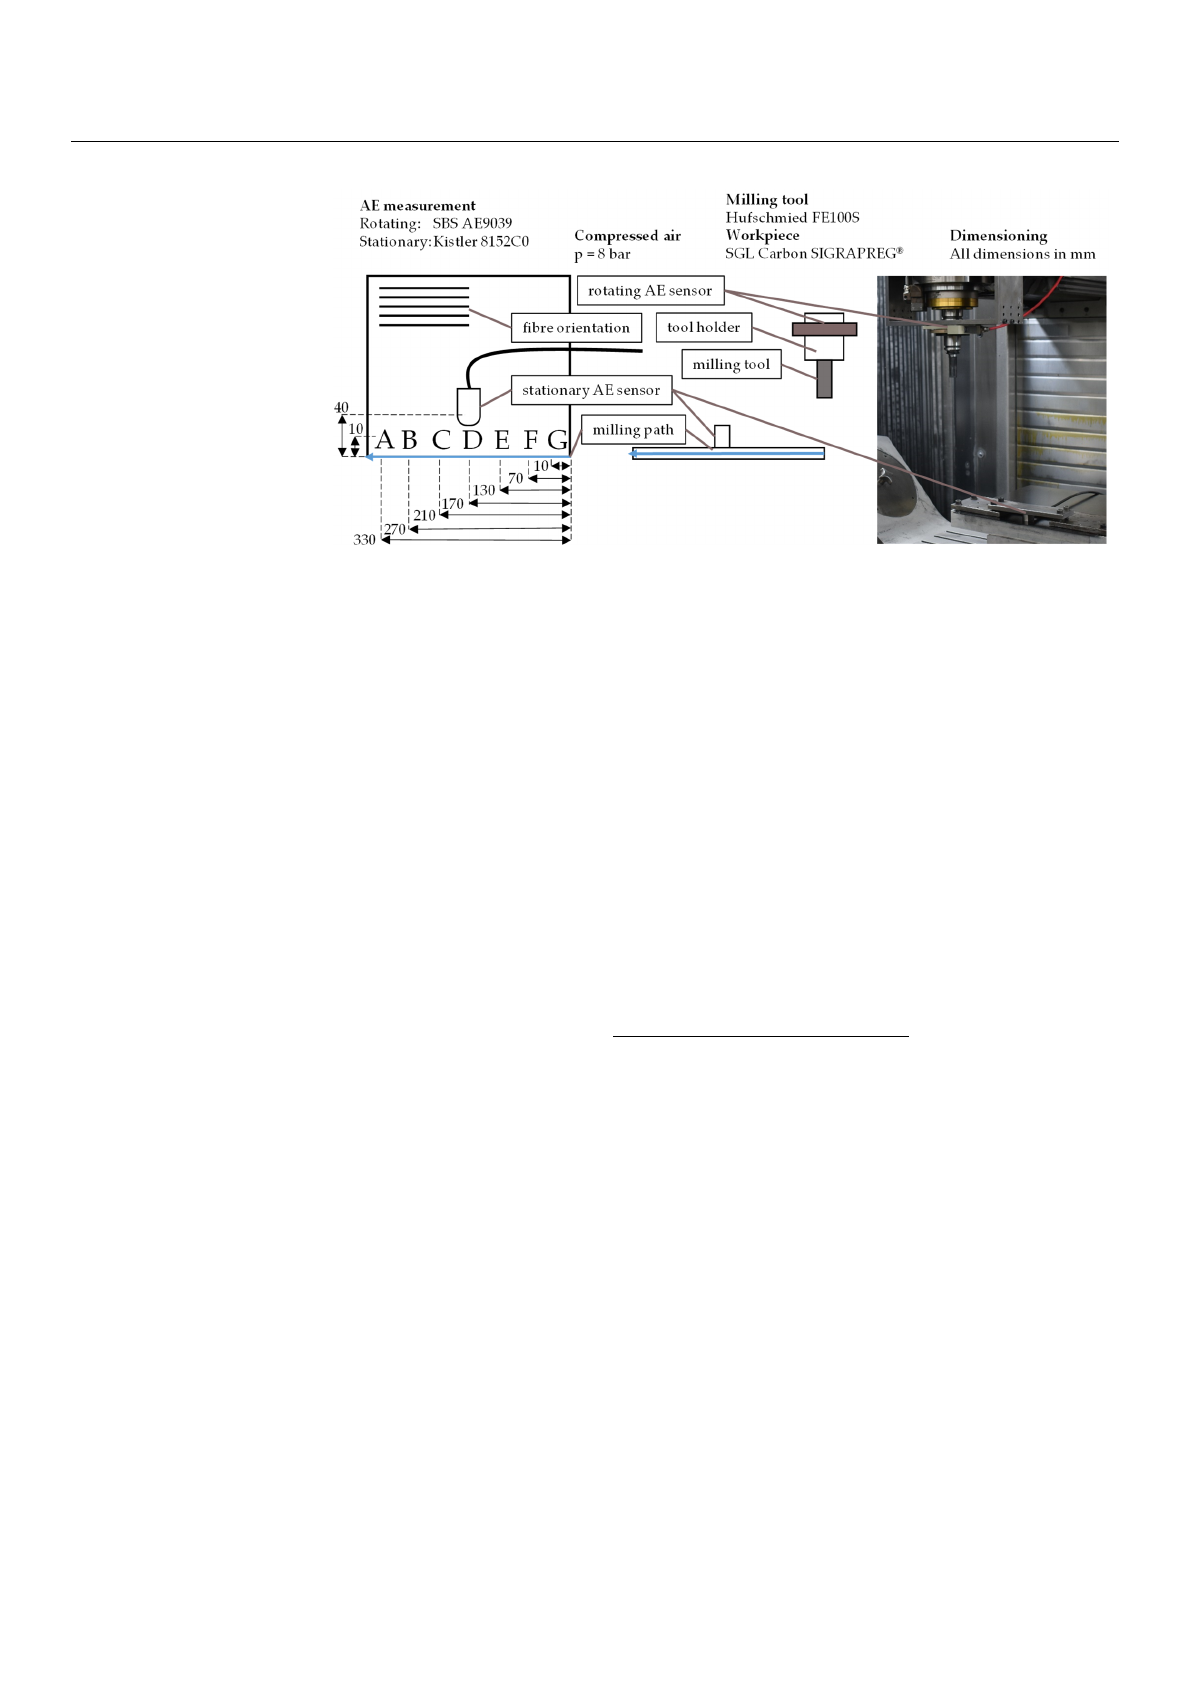
configured in such a way that reflection was negligible. AE signals are emitted at different
distances d and under different angles
β
between the signal path and fibre orientation. A
representation of the experimental setup is given in Figure 3.
J. Manuf. Mater. Process. 2022,6, 118 5 of 13
J. Manuf. Mater. Process. 2022, 6, 118 5 of 14
measurement programs, signal processing and model parameterisation scripts are written
with Python 3.9.5 from P
YTHON
S
OFTWARE
F
OUNDATION
, Wilmington, USA. Sensors,
clamping setup, and AE sources were configured in such a way that reflection was negli-
gible. AE signals are emitted at different distances d and under different angles β between
the signal path and fibre orientation. A representation of the experimental setup is given
in Figure 3.
Figure 3. Sensor placement and AE source positioning for the AE experiments.
For this setup, the angle between fibre direction and AE propagation path β is in the
range of 10.6° < β < 90° with the AE propagating distance d in the range of 30 mm < d <
162 mm. Since the angle between AE propagation path and fibre direction as well as the
distance between the sensor and AE source is always known, models for their influence
on the AE measurement signal can be parameterised in further signal processing steps.
Linear time-invariant (LTI) transfer functions and frequency gain parameter tables
have been implemented to obtain models, which can be used to reconstruct attenuated,
and dispersed frequency spectra of measurement data to its shape and amplitude emitted
at the AE source. Approaches to reconstruct the time-domain data of the AE emitted at
the source have been tested with two identical AE sensors but did not achieve satisfying
model performance. ANN and autoregressive exogenous models (ARX) have been ap-
plied on the acquired datasets as well, but robust and acceptable modelling could not be
accomplished. Further investigation of these approaches was aborted due to the excessive
computing effort during model teaching. To identify a transfer function TF(s), a generic
structure of the filter function was assumed for the optimization algorithm according to
Equation (4).
TF(s) = asas ⋯asa
bsbs⋯bsb (4)
When a certain threshold of n is surpassed, only marginal model performance im-
provement is accomplished whereas computational effort for optimisation increases
sharply for higher orders of TF(s). Therefore, model order n is first set to n = 1 and then
gradually increased. Parameters a
n
to a
0
and b
n
to b
0
of the TF filter were subject to varia-
tion by the optimisation algorithm. AE induced with a minimal distance to the sensor with
negligible effect of attenuation, dispersion, and reflection were defined as target signals.
To evaluate the filter parameters proposed by the optimisation algorithm, frequency spec-
tra of both the attenuated and filtered and the target acoustic emission measurement data
were determined by Fourier transform. Since the amplitudes of these frequency spectra
are calculated for discrete frequencies, the deviations can be calculated for each. Devia-
tions can be taken as absolute value and then summed. The sum of all absolute deviations
Figure 3. Sensor placement and AE source positioning for the AE experiments.
For this setup, the angle between fibre direction and AE propagation path
β
is in the
range of 10.6
◦
<
β
< 90
◦
with the AE propagating distance d in the range of 30 mm < d <
162 mm. Since the angle between AE propagation path and fibre direction as well as the
distance between the sensor and AE source is always known, models for their influence on
the AE measurement signal can be parameterised in further signal processing steps.
Linear time-invariant (LTI) transfer functions and frequency gain parameter tables
have been implemented to obtain models, which can be used to reconstruct attenuated,
and dispersed frequency spectra of measurement data to its shape and amplitude emitted
at the AE source. Approaches to reconstruct the time-domain data of the AE emitted at the
source have been tested with two identical AE sensors but did not achieve satisfying model
performance. ANN and autoregressive exogenous models (ARX) have been applied on the
acquired datasets as well, but robust and acceptable modelling could not be accomplished.
Further investigation of these approaches was aborted due to the excessive computing
effort during model teaching. To identify a transfer function TF(s), a generic structure of
the filter function was assumed for the optimization algorithm according to Equation (4).
TF(s)=ansn+an−1sn−1+. . . +a1s1+a0
bnsn+bn−1sn−1+. . . +b1s1+b0
(4)
When a certain threshold of n is surpassed, only marginal model performance im-
provement is accomplished whereas computational effort for optimisation increases sharply
for higher orders of TF(s). Therefore, model order n is first set to n = 1 and then gradually
increased. Parameters a
n
to a
0
and b
n
to b
0
of the TF filter were subject to variation by the
optimisation algorithm. AE induced with a minimal distance to the sensor with negligible
effect of attenuation, dispersion, and reflection were defined as target signals. To evaluate
the filter parameters proposed by the optimisation algorithm, frequency spectra of both
the attenuated and filtered and the target acoustic emission measurement data were deter-
mined by Fourier transform. Since the amplitudes of these frequency spectra are calculated
for discrete frequencies, the deviations can be calculated for each. Deviations can be taken
as absolute value and then summed. The sum of all absolute deviations defines the quality
criterion of the filter function to be minimised by the optimisation algorithm. To avoid
numerical issues when executing the algorithm, sample time can be used as timebase.
Frequency spectra can also be reconstructed using large-scale frequency gain parame-
ter tables. For each frequency in the spectra, a specific gain can be identified. Attenuation
coefficients are widely used in literature and easy to calculate. However, the approach may
be difficult to implement as it delivers gains only for discrete frequencies in the spectra and
does not represent a physically realisable filter. To increase the robustness of this approach,
Loading more pages...